Harper Hughes · 18 October 2026
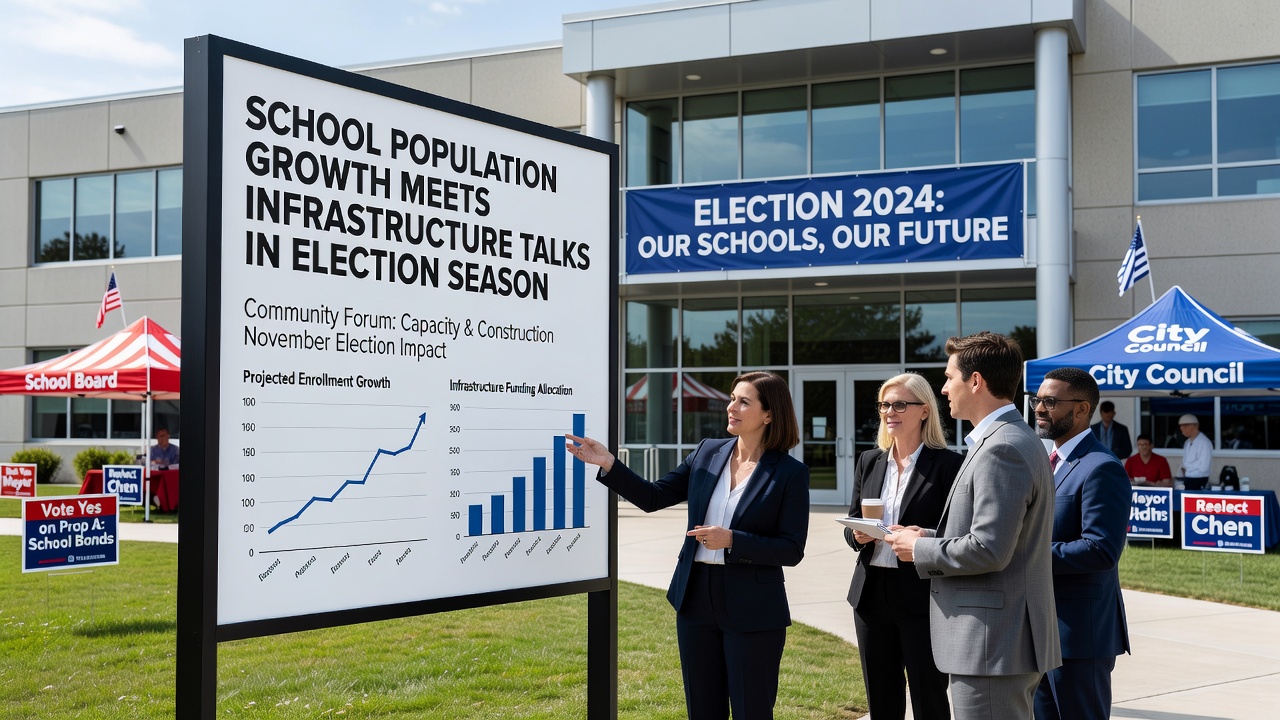
School Population Growth Meets Infrastructure Talks in Election Season
School enrollment figures have risen steadily across multiple districts, driven by demographic shifts and migration patterns that researchers have tracked through census records and state education reports, while infrastructure demands grow alongside them in ways that intersect directly with upcoming election cycles set for late 2026. Data from the National Center for Education Statistics shows enrollment increases of 4 to 7 percent in suburban and mid-sized urban areas over the past five years, creating pressure on aging facilities and transportation networks that local governments must address through budget allocations and bond measures.
Candidates in various regions have placed these combined issues on campaign platforms because population surges affect classroom capacity, teacher hiring, and maintenance schedules, yet funding mechanisms often require voter approval. Figures from the U.S. Census Bureau indicate that school-age populations in certain counties expanded faster than housing stock, leading planners to examine existing building conditions and project future needs through 2030. Election timelines in October 2026 place these topics under heightened scrutiny as communities review proposed tax adjustments and state aid formulas.
Enrollment Trends and Facility Strain
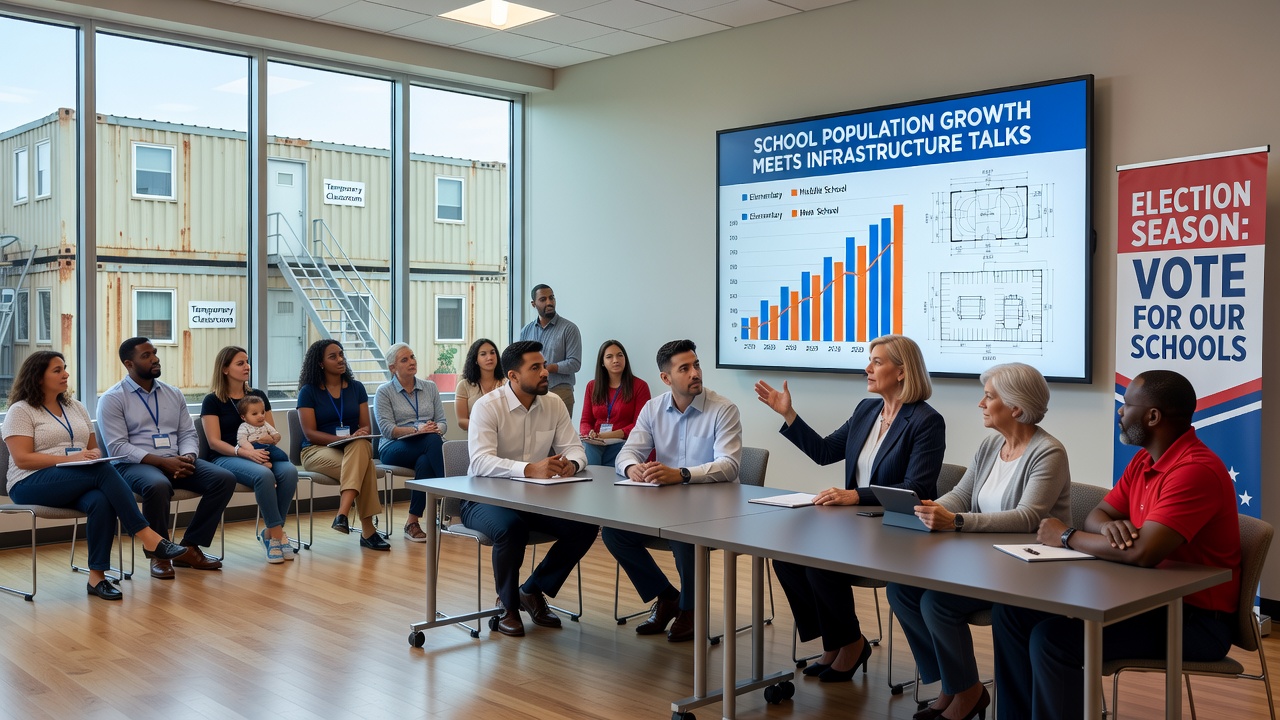
Population data compiled by state education departments reveal that districts experiencing net gains of several thousand students since 2020 now face decisions about modular classroom additions versus full-scale renovations, with costs varying by region and construction standards. Observers note that older structures built before current seismic and energy codes require upgrades that exceed routine maintenance budgets, prompting discussions about long-term capital planning. Those who've analyzed enrollment projections point to continued growth in specific corridors where new residential developments attract families, while rural areas sometimes see declines that shift resources elsewhere.
Transportation infrastructure ties into these patterns because bus routes and road access must accommodate higher daily student volumes, and studies from the Federal Highway Administration link increased traffic near schools to the need for intersection improvements and pedestrian safety measures. Data indicates that districts with rapid growth often coordinate with municipal public works departments to align school calendars with construction timelines, reducing disruptions during peak enrollment periods.
Policy Responses Across Regions
State legislatures have introduced measures to adjust per-pupil funding formulas in response to documented enrollment changes, and some proposals include dedicated infrastructure accounts that would draw from sales tax revenues or federal grants. According to reports issued by the U.S. Department of Education, districts that secured voter-approved bonds in prior cycles completed projects on time when population forecasts proved accurate, whereas others delayed work until updated counts became available. International comparisons from OECD education indicators show similar pressures in growing metropolitan areas of Canada and Australia, where governments adjusted capital spending after reviewing census-linked enrollment models.
Community meetings scheduled ahead of the 2026 elections have featured presentations on these topics, with officials presenting cost estimates for new construction alongside options for adaptive reuse of existing buildings. Researchers at university planning centers have contributed analyses that compare projected student numbers against available square footage, highlighting gaps that range from several hundred thousand to over a million square feet in larger systems. These assessments feed into campaign materials as candidates outline priorities for education spending and infrastructure resilience.
Funding Mechanisms and Voter Considerations
Bond referendums remain a primary tool for financing school infrastructure, and records from recent election cycles demonstrate passage rates that correlate with clear documentation of enrollment growth and facility condition reports. Experts have observed that when districts combine population data with detailed engineering assessments, voter support tends to hold steady across demographic groups. State matching funds sometimes supplement local efforts, though eligibility rules vary and require compliance with updated reporting standards set by education agencies.
October 2026 approaches as a period when many districts finalize their capital improvement plans, incorporating the latest enrollment projections released by state statistical offices. Those plans often address not only classroom space but also technology infrastructure, safety systems, and accessibility features mandated by federal guidelines. Industry organizations such as the Council of the Great City Schools have published case studies showing how coordinated planning reduced long-term costs when growth was anticipated several years in advance.
Public records indicate that some municipalities have formed joint task forces involving school boards, city councils, and transportation authorities to synchronize project schedules with election-driven budget cycles. These collaborations produce timelines that align construction phases with periods of lower student activity, and they incorporate contingency provisions for unexpected enrollment spikes. Data from regional planning commissions further supports the integration of school infrastructure needs into broader land-use and housing policies.
Conclusion
School population growth continues to shape infrastructure priorities as election seasons unfold, with data from government statistical agencies and education departments guiding teh development of funding proposals and project lists. Districts that align enrollment forecasts with facility assessments position themselves to present concrete options to voters in 2026, while coordination across agencies helps manage timelines and resource allocation. The intersection of these factors produces measurable outcomes in capital planning documents that communities review during campaign periods.